

We recently addressed volatility in global stock markets with our clients. Market volatility brought on by significant events such as war is always unsettling, but not uncommon historically. Notably, the US stock market has sold off between 10% to 30% several times in just the past few years— in some cases in much greater amounts than the market’s reaction so far to war in Ukraine.
The following is an excerpt from our client letter:
To put recent 2022 moves into perspective, here is a summary of major global stock market index returns year-to-date in 2022, and for the calendar years 2021 and 2020:
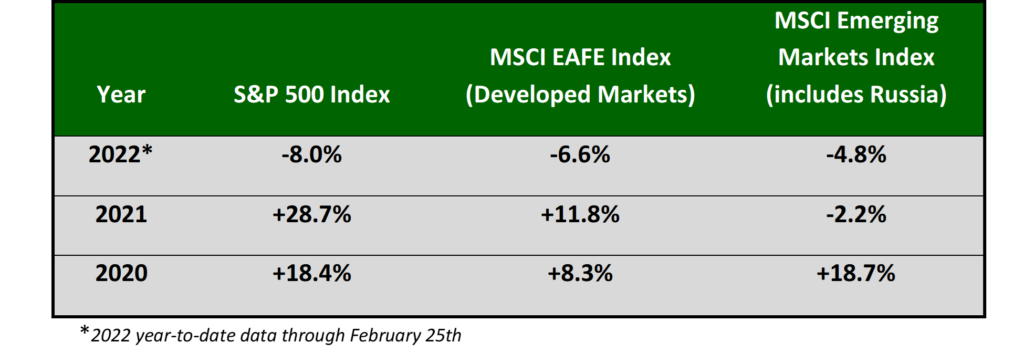
Since the highs in the very beginning of January, we have seen a move lower in US and global stock markets. The US stock market entered official correction territory when the S&P 500 Index was down over 11% year-to-date on February 23rd and the daily swings have remained volatile with sharply positive and negative moves since then.
For some perspective, these moves to date are well within some previous corrections seen in recent years:
- In February and March 2020 there was a greater than 30% correction due to significant uncertainty from the Covid pandemic.
- Over 2018, the S&P 500 index had two sharp 10% corrections in February and March followed by a move higher through September of that year; it then declined 20% from those September highs through Christmas Eve.
News and data will continue their non-stop flow in 2022 and it is this information that stock markets, as forward discounting mechanisms, are always digesting and processing in their daily prices. Many times, the news and data are not perfectly quantifiable, or they are incomplete and in need of future clarification which can lead to periods of market under- or over- reactions.
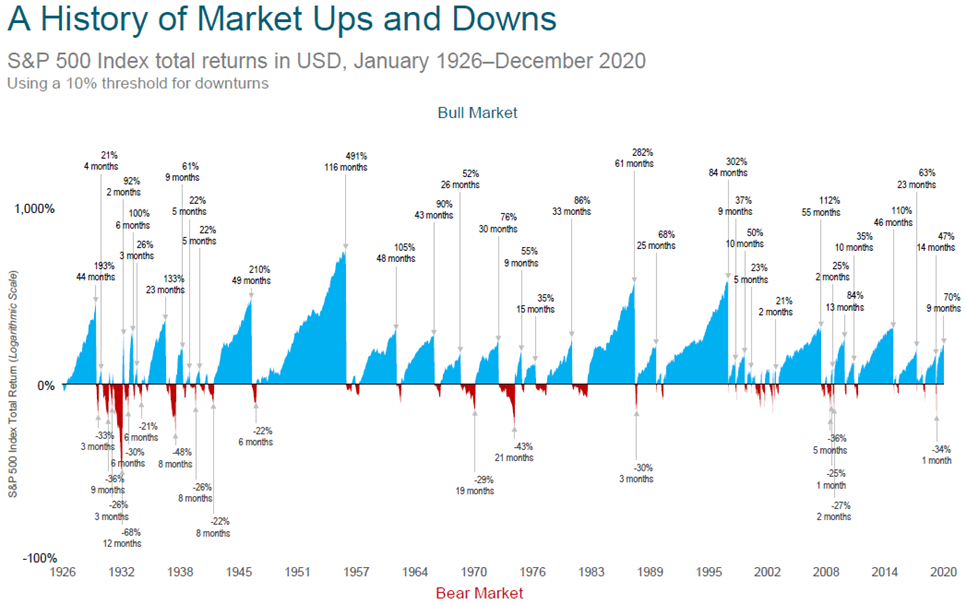
With this in mind, and because a picture is worth a thousand words, we want to share two long-term charts. Together they offer a good summary of the history of bull versus bear markets and longer-term stock market performance in the face of regular negative events.
A History of Market Ups and Downs: A comparison of stock market increases compared to corrections of greater than 10% from 1926 through 2020.
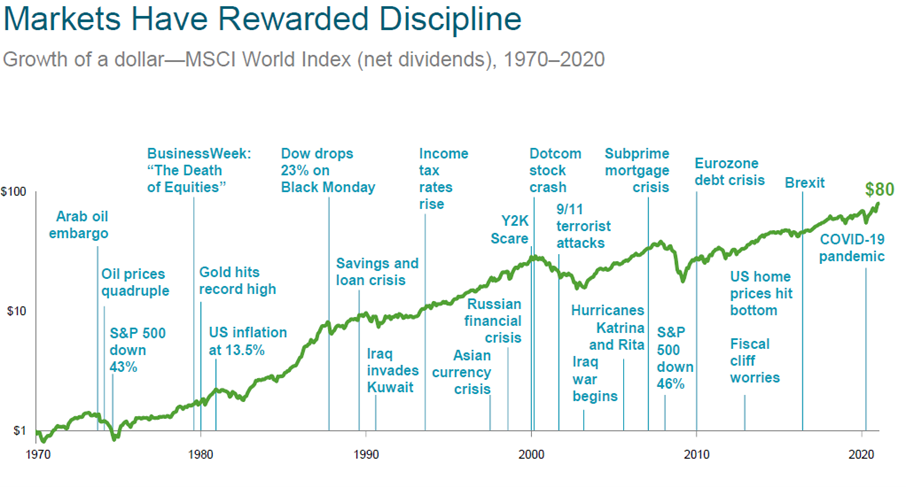
Markets Have Rewarded Discipline: It has paid off to look beyond the concerns and news of today to the long-term growth potential of markets over time.
We hope these combined charts help put recent market moves (and possible additional negative moves nearer-term) in a longer-term perspective. We manage volatility and uncertainty with a long-term view and portfolio construction based on historical market dynamics and each client’s unique financial plan and goals. If you would like to speak further or in more detail about your portfolio, please don’t hesitate to contact us.
____________________________________________________________________________________________
A History of Market Ups and Downs:
Past performance is no guarantee of future results. Indices are not available for direct investment; therefore, their performance does not reflect the expenses associated with the management of an actual portfolio. Chart end date is 12/31/2020, the last trough to peak return of 70% represents the return through December 2020. Due to availability of data, monthly returns are used January 1926 through December 1989; daily returns are used January 1990 through present. Periods in which cumulative return from peak is –10% or lower and a recovery of 10% from trough has not yet occurred are considered bear markets. Bull markets are subsequent rises following the bear market trough through the next recovery of at least 10%. The chart shows bear markets and bull markets, the number of months they lasted and the associated cumulative performance for each market period. Results for different time periods could differ from the results shown. Bull and bear markets less than 20% in magnitude are not labeled. Source: S&P data © 2021 S&P Dow Jones Indices LLC, a division of S&P Global. All rights reserved.
Markets Have Rewarded Discipline:
In US dollars. MSCI data © MSCI 2021, all rights reserved. Indices are not available for direct investment. Their performance does not reflect the expenses associated with the management of an actual portfolio. Past performance is no guarantee of future results.